Seattle Tide Chart: Largest Same-Day Low Tide Difference
Seattle's largest difference between two listed low tides on the same local date is 10.755 ft (3.278 m, converted) during October 10–November 8, 2026. It occurs on 2026-10-29.
The paired turns
On 2026-10-29, NOAA lists low tides at 01:16 (-3.005 ft) and 13:58 (7.750 ft).
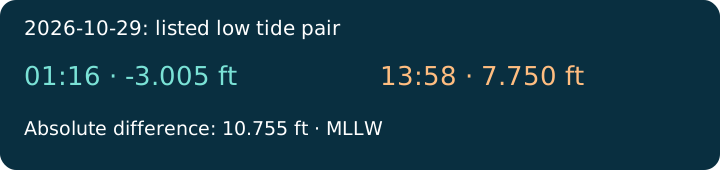
Compare the two listed heights when choosing which low-water event to check in Seattle.
Download all paired dates as CSVAll qualifying dates
| Local date | Times | Heights (ft MLLW) | Difference (ft) |
|---|---|---|---|
| 2026-10-10 | 11:16 / 23:45 | 3.456 / 0.019 | 3.437 |
| 2026-10-12 | 00:17 / 12:41 | -0.626 / 5.554 | 6.180 |
| 2026-10-13 | 00:50 / 13:26 | -0.959 / 6.445 | 7.404 |
| 2026-10-14 | 01:24 / 14:15 | -0.975 / 7.150 | 8.125 |
| 2026-10-15 | 02:03 / 15:12 | -0.696 / 7.638 | 8.334 |
| 2026-10-16 | 02:45 / 16:28 | -0.187 / 7.861 | 8.048 |
| 2026-10-17 | 03:34 / 18:31 | 0.454 / 7.668 | 7.214 |
| 2026-10-18 | 04:30 / 19:53 | 1.100 / 7.077 | 5.977 |
| 2026-10-19 | 05:33 / 20:34 | 1.638 / 6.333 | 4.695 |
| 2026-10-20 | 06:38 / 21:00 | 2.025 / 5.456 | 3.431 |
| 2026-10-21 | 07:37 / 21:22 | 2.337 / 4.403 | 2.066 |
| 2026-10-22 | 08:30 / 21:44 | 2.703 / 3.149 | 0.446 |
| 2026-10-23 | 09:18 / 22:10 | 3.218 / 1.737 | 1.481 |
| 2026-10-24 | 10:02 / 22:39 | 3.907 / 0.274 | 3.633 |
| 2026-10-25 | 10:45 / 23:13 | 4.732 / -1.081 | 5.813 |
| 2026-10-26 | 11:29 / 23:50 | 5.617 / -2.162 | 7.779 |
| 2026-10-28 | 00:31 / 13:04 | -2.828 / 7.203 | 10.031 |
| 2026-10-29 | 01:16 / 13:58 | -3.005 / 7.750 | 10.755 |
| 2026-10-30 | 02:05 / 15:03 | -2.693 / 8.033 | 10.726 |
| 2026-10-31 | 02:59 / 16:24 | -1.970 / 7.924 | 9.894 |
| 2026-11-01 | 02:58 / 17:03 | -0.966 / 7.234 | 8.200 |
| 2026-11-02 | 04:03 / 18:26 | 0.168 / 5.988 | 5.820 |
| 2026-11-03 | 05:12 / 19:22 | 1.302 / 4.476 | 3.174 |
| 2026-11-04 | 06:21 / 20:06 | 2.377 / 2.920 | 0.543 |
| 2026-11-05 | 07:26 / 20:43 | 3.401 / 1.477 | 1.924 |
| 2026-11-06 | 08:24 / 21:16 | 4.397 / 0.258 | 4.139 |
| 2026-11-07 | 09:17 / 21:46 | 5.350 / -0.677 | 6.027 |
| 2026-11-08 | 10:06 / 22:16 | 6.211 / -1.308 | 7.519 |
How the answer was calculated
The calculation takes the absolute difference between exactly two low predictions on each station-local calendar date.
Dates with fewer or more than two matching turns are excluded rather than interpolated.
The table covers 28 paired dates from the 30-day response.
All dates tied at the maximum are included in the answer.
NOAA supplies the feet values relative to Mean Lower Low Water (MLLW).
Metres are calculated here using one foot equal to 0.3048 metres.
Times follow NOAA's local standard or daylight time setting, including the November clock change.
A height difference does not describe current speed or the duration of a safe access window.
Predictions do not account for every weather-driven change in actual water levels.
The station record identifies Seattle, station 9447130.